2022 SafeTREC Traffic Safety Fact Sheets feature recent data on some of California's most pressing traffic safety issues to help inform future road safety efforts
UC Berkeley SafeTREC is excited to announce the release of the 2022 series of Traffic Safety Fact Sheets, which feature traffic safety data and trends at the national and state level on a variety of road safety topics. This series also highlights the Safe System approach to road safety, which the United States Department of Transportation uses to work towards zero roadway fatalities and serious injuries. This approach recognizes that people may make unsafe decisions and designs a system with many redundancies in place to protect everyone, especially the most vulnerable road users. The Federal Highway Administration (FHWA) names safe road users, safe vehicles, safe speeds, safe roads, and post-crash care as key elements of a Safe System. These elements together create multiple layers of protection to improve safety.
Bicycle Safety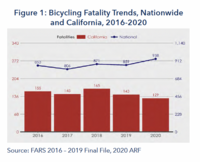
Bicycling is becoming more popular across the country, for commuting, exercise, and leisure. However, in the event of a traffic crash between a motor vehicle and a bicyclist, the bicyclist is the more vulnerable party and more likely to be injured or killed. In 2020, there were 938 bicyclists killed in a traffic crash in the United States. American Indian/Alaska Native persons had the highest per capita rate of bicyclists deaths, followed by Black and Hispanic persons; the differential was smaller than for other categories of traffic deaths by race. Read the full 2022 SafeTREC Traffic Safety Facts: Bicycle Safety.
Pedestrian Safety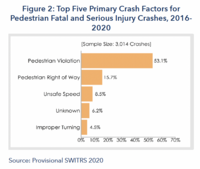
Everyone is a pedestrian, whether or not walking is one’s primary mode of travel. As a commute mode, walking is gaining in numbers. In 2020, pedestrian deaths accounted for 16.8 percent of all crash fatalities and nearly one-quarter (24.3 percent) of pedestrian fatalities involved a hit-and-run crash. From 2011 to 2020, pedestrian fatalities increased 46.2 percent while other traffic deaths only increased by 14.4 percent. From 2019 to 2020, pedestrian fatalities increased 3.9 percent, despite a 13.2 percent reduction in driving. Compared with all other racial categories, American Indian/Alaska Native persons had a substantially higher per-capita rate of fatalities among pedestrians. Black persons had the second highest rate of pedestrian traffic deaths. Preliminary 2021 data suggest that this trend will continue in the near future, reporting that 8,730 people died in roadway fatalities in the first quarter, a 10.5 percent increase from the same period in 2020. Read the full 2022 SafeTREC Traffic Safety Facts: Pedestrian Safety.
Motorcycle Safety 
Crashes involving motorcycles are a major traffic safety concern in the United States. Since motorcyclists are susceptible to injury during crashes, they comprise a disproportionate share of all injured and killed vehicle occupants. In 2020, motorcyclists comprised 14.4 percent of all traffic deaths in the US. The primary countermeasures used to address this problem include motorcycle helmet laws and other helmet-oriented programs, rider training and licensing programs, vehicle enhancements, including anti-lock braking technology, rider conspicuity programs, campaigns to increase other road users’ awareness of motorcycles, and campaigns to reduce impaired riding. Read the full 2022 SafeTREC Traffic Safety Facts: Motorcycle Safety.
Occupant Protection 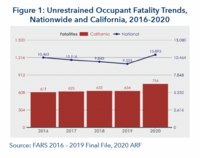
Restraint devices such as seat belts are a key element of motor vehicle occupant protection systems. Each year, NHTSA conducts the National Occupant Protection Use Survey (NOPUS) that measures, among many variables, the daytime use of seat belts by occupants age eight and older. The 2020 NOPUS reported that seat belt use was 90.3 percent among front-seat passengers, a slight decrease from the 90.7 percent observed in 2018. This change, along with the changes in subsets such as time of day or day of the week, was not statistically significant. Read the full 2022 SafeTREC Traffic Safety Facts: Occupant Protection.
Emergency Medical Services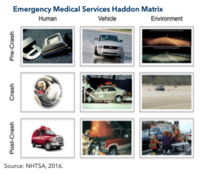
There are many contributing factors in motor vehicle crashes. Emergency Medical Services (EMS) play a critical role post-crash to reduce fatalities and serious injuries. Recent studies show that an effective emergency trauma care system can improve survival from serious injuries by as much as 25 percent and county-level coordinated systems of trauma care can reduce crash fatalities rates as much as 50 percent. The Haddon Matrix applies basic principles of public health to motor vehicle-related injuries (see Figure 1). The matrix looks at the factors in the pre-crash, crash, and post-crash phases to see how the driver, vehicle, and environment affect the outcome. Specifically, it identifies the factors that impact the prevention, severity, and survivability of crashes. Read the full 2022 SafeTREC Traffic Safety Facts: Emergency Medical Services.
Alcohol-Impaired Driving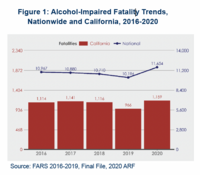
While alcohol-impaired driving fatalities have fallen significantly in the last three decades, NHTSA reports that alcohol-impaired driving still comprises a large percentage of traffic injuries and fatalities. On average in 2020, someone died from an alcohol-impaired driving crash every 45 minutes. There was an increase in the number of alcohol-impaired driving fatalities and rate per 100 million Vehicle Miles Traveled (VMT) in the United States between 2019 and 2020.Read the full 2022 SafeTREC Traffic Safety Facts: Alcohol-Impaired Driving.
Drug-Involved Driving
The use of cannabis, prescription drugs, and other drugs are increasingly prominent on roadways in the United States, where 25.3 percent of the nation’s 38,824 fatalities in 2020 were related to drug-involved driving. Driving can be impaired by a variety of legal and illegal drugs, substances, and medications. The effect of specific drugs on behavior and driving skills vary considerably depending on how they act in the brain and are metabolized. They can slow reaction time, decrease coordination, increase aggressive and reckless driving, impair cognitive function, or cause drowsiness. All of these effects can contribute to crash risk. Read the full 2022 SafeTREC Traffic Safety Facts: Drug-Involved Driving.
Aging Road Users
The older adult population in the United States aged 65 and older is expected to almost double between 2016 and 2060, from 49 million to 95 million. In 2020, there were 6,549 people aged 65 and older killed in traffic crashes in the United States; this accounted for 16.9 percent of all traffic fatalities. Older drivers 65 and older involved in fatal crashes decreased by 9.8 percent between 2019 and 2020. As drivers age, physical and mental changes including reduced visual acuity, increased fragility, restricted movement, and cognitive impairment may directly and indirectly result in driving impairments.Read the full 2022 SafeTREC Traffic Safety Facts: Aging Road Users.
Speed-Related Crashes
A speeding-related crash is defined as one where a driver is speeding, racing, driving too fast for the conditions, or driving in excess of the posted speed limit. In the United States, in 2020, over one in four (29.0 percent) fatalities involved speeding, a rate that increased after plateauing in the late 2010s, following a decline earlier in the decade. Speeding reduces a driver’s ability to steer safely around curves or objects, reduces the amount of time a driver has to react to a dangerous situation, and extends safe stopping distances. Analyses presented in the police traffic services program area refer to speeding-related fatal and serious injuries. Read the full 2022 SafeTREC Traffic Safety Facts: Speed-Related Crashes.
Distracted Driving
The National Highway Traffic Safety Administration (NHTSA) defines distracted driving as activities that divert attention away from safe driving. This may include talking on the phone, texting, eating or drinking, manipulating audio systems, etc. According to the National Safety Council, cell phones remain a top distraction because of the length of time they are used by drivers on a daily basis. Analyses presented in the distracted driving program area are defined by a driver’s inattention to driving due to some other activity. Read the full 2022 SafeTREC Traffic Safety Facts: Distracted Driving.
Funding for this program was provided by a grant from the California Office of Traffic Safety, through the National Highway Traffic Safety Administration.