2021 SafeTREC Traffic Safety Fact Sheets feature recent data on some of California's most pressing traffic safety issues to help inform future road safety efforts
UC Berkeley SafeTREC is excited to announce the release of the 2021 series of Traffic Safety Fact Sheets, which feature traffic safety data and trends at the national and state level on a variety of road safety topics. This series also highlights the Safe System approach to road safety. Historically, road safety efforts focused on changing human behaviors to prevent crashes. The Safe System approach reframes efforts to save lives by expecting crashes to happen and focusing attention on reducing the severity of injuries when a crash occurs. By understanding the nuances of various types of traffic crashes, transportation professionals can better address every aspect of crash risks and implement multiple layers of protection to ensure that everyone traveling on California roadways will go safely.
Bicycle Safety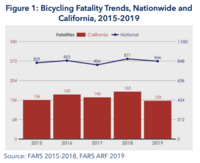
Bicycling is becoming more popular across the country, for commuting, exercise, and leisure. However, in the event of a traffic crash between a motor vehicle and a bicyclist, the bicyclist is the more vulnerable party and more likely to be injured or killed than a motor vehicle occupant. In 2019, there were 846 bicyclists killed in a traffic crash in the United States. Read the full 2021 SafeTREC Traffic Safety Facts: Bicycle Safety.
Pedestrian Safety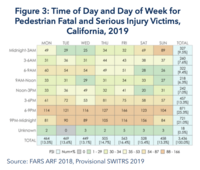
Everyone is a pedestrian, whether or not walking is one’s primary mode of travel. As a commute mode, walking is gaining in numbers. Based on the first six months of 2020, the GHSA projects that pedestrian fatalities in the nation will be on pace with 2019 despite large reductions in motor vehicle travel associated with COVID-19. Pedestrian fatalities as a proportion of total motor vehicle deaths increased from 13.0 percent in 2010 to 17.3 percent in 2019. Moreover, pedestrian fatalities increased 46.5 percent from 2010 to 2019 while other traffic deaths increased by 4.9 percent. Read the full 2021 SafeTREC Traffic Safety Facts: Pedestrian Safety.
Motorcycle Safety
Crashes involving motorcycles are a major traffic safety concern in the United States. Since motorcyclists are susceptible to injury during crashes, they comprise a disproportionate share of all injured and killed vehicle occupants. In 2018, motorcyclists were 27 times more likely than passenger car occupants to be fatally injured in a traffic crash, per vehicle miles traveled. Read the full 2021 SafeTREC Traffic Safety Facts: Motorcycle Safety.
Occupant Protection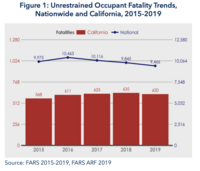
Restraint devices such as seat belts are a key element of motor vehicle occupant protection systems. Each year, NHTSA conducts the National Occupant Protection Use Survey (NOPUS) that measures, among many variables, the use of seat belts by occupants age eight and older. The 2019 NOPUS reported that seat belt use was 90.7 percent among front-seat passengers, a slight increase from the 89.6 percent observed in 2018. Additionally, the 2019 survey found that seat belt use increased during both weekday rush hours and non rush hours. Use during weekday rush hours increased from 89.3 percent in 2018 to 90.7 percent in 2019 and use during non-rush hours increased from 89.1 percent in 2018 to 90.8 percent in 2019. Read the full 2021 SafeTREC Traffic Safety Facts: Occupant Protection.
Emergency Medical Services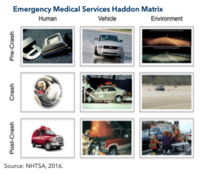
There are typically many contributing factors in motor vehicle crashes. Emergency Medical Services (EMS) play a critical role post-crash to reduce fatalities and serious injuries. Recent studies show that an effective emergency trauma care system can improve survival from serious injuries by as much as 25 percent and county-level coordinated systems of trauma care can reduce crash fatalities rates as much as 50 percent. Read the full 2021 SafeTREC Traffic Safety Facts: Emergency Medical Services.
Alcohol-Impaired Driving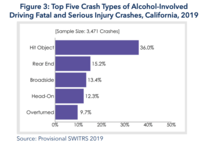
While alcohol-impaired driving fatalities have fallen significantly in the last three decades, NHTSA reports that alcohol-impaired driving still comprises a large percentage of traffic injuries and fatalities. On average in 2019, one person died from an alcohol-impaired driving crash every 52 minutes. There was a decrease in the number of alcohol-impaired driving fatalities and rate per 100 million Vehicle Miles Traveled (VMT) in the United States between 2018 and 2019. Read the full 2021 SafeTREC Traffic Safety Facts: Alcohol-Impaired Driving.
Drug-Involved Driving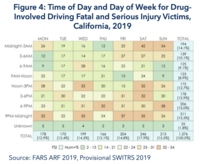
The use of cannabis, prescription drugs, and other drugs are increasingly prominent on roadways in the United States, where 25.1 percent of the nation’s 36,096 fatalities in 2019 were related to drug-involved driving. Driving can be impaired by a variety of legal and illegal drugs, substances, and medications. Several states have legalized the use of medical and/or recreational cannabis, increasing concerns about traffic safety. Aside from alcohol, cannabis is the most frequently detected drug in drivers who are in crashes. The impact of drugs on the brain and behavior varies considerably depending on the type of drug and how it is metabolized. Read the full 2021 SafeTREC Traffic Safety Facts: Drug-Involved Driving.
Aging Road Users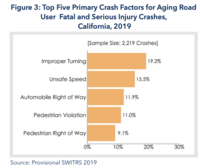
The older adult population in the United States aged 65 and older is expected to almost double between 2016 and 2060, from 49 million to 95 million. In 2019, there were 7,214 people aged 65 and older killed in traffic crashes in the United States; this accounted for 20.0 percent of all traffic fatalities. To provide context, the overall population aged 65 and older accounted for 16.5 percent of people in the United States and 20.2 percent of all licensed drivers in 2019. California has the largest number of licensed drivers aged 65 and older in the nation with 4,516,813, or 16.6 percent of all licensed drivers in the state. Read the full 2021 SafeTREC Traffic Safety Facts: Aging Road Users.
Speeding-Related Crashes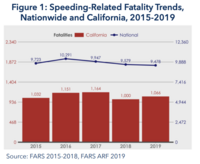
A speeding-related crash is defined as one where a driver is speeding, racing, driving too fast for the conditions, or driving in excess of the posted speed limit. In the United States, in 2019, over one in four (26.3 percent) fatalities involved speeding, a proportion that has remained steady since 2017 following a decline in the prior decade. Speeding reduces a driver’s ability to steer safely around curves or objects, reduces the amount of time a driver has to react to a dangerous situation, and extends safe stopping distances. Read the full 2021 SafeTREC Traffic Safety Facts: Speeding-Related Crashes.
Distracted Driving
The National Highway Traffic Safety Administration (NHTSA) defines a distraction-affected crash as one where a driver was determined to be distracted at the time of the crash. According to the National Safety Council, mobile devices are among the top distractions for drivers nationwide. Studies have found that talking on cell phones, both handheld and hands-free, increases crash risk by about four times relative to baseline driving. Built-in communication technologies, along with hands-free cell phone technologies, draw attention away from driving. The ability to multitask is a myth, as attention toggles from either driving to vehicle technologies. The longer time one pays attention to the technology, the less time attention is paid to the roadway environment. Read the full 2021 SafeTREC Traffic Safety Facts: Distracted Driving.
Funding for this program was provided by a grant from the California Office of Traffic Safety, through the National Highway Traffic Safety Administration.