2020 SafeTREC Traffic Safety Fact Sheets feature recent data on some of California's most pressing traffic safety issues to help inform future road safety efforts during the pandemic
COVID-19 and Traffic Safety
The COVID-19 pandemic has led to a series of public health measures to keep communities safe, like the stay at home order and physical distancing orders affecting operations of schools, restaurants, retail, and other non essential businesses. Even as these measures change over time and some communities reopen and resume activities, it is evident that they have had not only economic effects, but have impacted other aspects of everyday life, including road safety and driver behavior. For instance, with fewer cars on the road, speeding has been occurring with greater frequency. From March 19 to April 30, 2020 the California Highway Patrol issued 4,000 citations for speeding over 100 mph, a 113% increase compared to the prior year.
In June of this year, UC Berkeley SafeTREC began aggregating injury crash data and exposure data from California on a weekly level as part of the launch of an Injury Crashes During COVID-19 dashboard on the Transportation Injury Mapping System (TIMS). The crash data comes from police-reported crashes that are added to the California Statewide Integrated Traffic Records System (SWITRS) by the California Highway Patrol (CHP). An initial descriptive analysis of the data revealed two leading observations:
- There is a noticeable reduction in the number of injury crashes along state highways in California; and
-
The reduction in fatal & severe crashes is smaller than the reduction in lower-level injuries. Moreover, the fatal and severe crash rate per 100 million VMT has not improved.
“This means that injury crashes that do occur along state highways in California are more severe. We still don’t know whether this is due to worse driver behavior and willingness to take more risks (e.g., a lot more excessive speeding), or due to fewer congestion-related injury crashes which usually involve minor injuries.” noted SafeTREC co-director Offer Grembek in a recent interview for the Vision Zero Network(link is external). “We are doing more research to better understand what is happening.”
Understanding Current Traffic Safety Data to Inform Future Road Safety Needs
During the pandemic as communities throughout the state undertake the process of reopening and resuming activities, and more vehicles return to highways and roads, it will be important to continue monitoring traffic patterns and driver behavior. It will also be important to compare this data to pre-COVID data to better understand how best to improve road safety in the future.
The 2020 SafeTREC Traffic Safety Fact Sheets
UC Berkeley SafeTREC recently released a series of Traffic Safety Fact Sheets compiling data and trends at the national and state level on a variety of road safety topics. While these data were reported prior to Covid-related changes on our roadways, this traffic safety information is still valuable in identifying where we have been and what we need to know moving forward to advance road safety during the pandemic and beyond.
Bicycle Safety: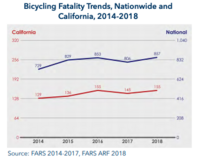
Bicycling is becoming more popular across the country for commuting, exercise, and leisure. However, in the event of a traffic crash between a motor vehicle and a bicyclist, the bicyclist is the more vulnerable party and more likely to be injured or killed than a motor vehicle occupant. In 2018, there were 857 bicyclists killed in a traffic crash in the United States. In California, bicycle fatalities increased 6.9 percent from 145 fatalities in 2017 to 155 fatalities in 2018. Read the full 2020 SafeTREC Traffic Safety Facts: Bicycle Safety.
Pedestrian Safety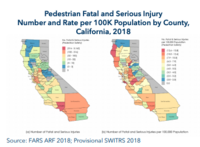
Everyone is a pedestrian, whether or not walking is one’s primary mode of travel. As a commute mode, walking is gaining in numbers. In its 2020 report, “Pedestrian Traffic Fatalities by State, 2019 Preliminary Data” the Governors Highway Safety Association (GHSA) reports that pedestrian fatalities in the nation have increased disproportionately to other traffic deaths. Pedestrian fatalities as a proportion of total motor vehicle deaths increased from 12 percent in 2009 to 17 percent in 2018. Moreover, pedestrian fatalities increased 53 percent from 2009 to 2018 while other traffic deaths increased by 2 percent. In California, pedestrian fatalities rose 26.0 percent from 709 in 2014 to 893 in 2018. Read the full 2020 SafeTREC Traffic Safety Facts: Pedestrian Safety.
Motorcycle Safety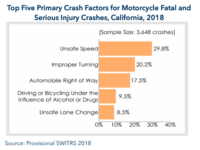
Crashes involving motorcycles are a major traffic safety concern in the United States. Since motorcycle riders are susceptible to injury during crashes, they comprise a disproportionate share of all injured and killed vehicle occupants. In 2018, there were 4,985 motorcyclists killed on public roadways in the United States. This number reflects an 8.5 percent increase from 2014, when 4,594 motorcyclists were killed. In California, the state recorded the second most motorcycle fatalities in the nation in 2018. Read the full 2020 SafeTREC Traffic Safety Facts: Motorcycle Safety.
Occupant Protection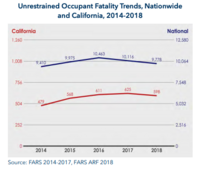
Restraint devices such as seat belts are a key element of motor vehicle occupant protection systems. Each year, the National Highway Traffic Safety Administration (NHTSA) conducts the National Occupant Protection Use Survey (NOPUS) that measures, among many variables, the use of seat belts by occupants aged eight and older. The 2019 NOPUS reported that seat belt use was 90.7 percent among front-seat passengers, a slight increase from the 89.6 percent observed in 2018. In 2018, California’s front seat belt use was observed to be 95.9 percent, which was the third-highest use rate in the nation. Read the full 2020 SafeTREC Traffic Safety Facts: Occupant Protection.
Emergency Medical Services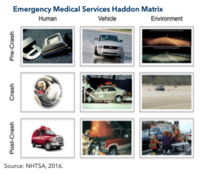
There are typically many contributing factors in motor vehicle crashes. Emergency Medical Services (EMS) play a critical role post-crash to reduce fatalities and serious injuries. Recent studies show that an effective emergency trauma care system can improve survival from serious injuries by as much as 25 percent and county-level coordinated systems of trauma care can reduce crash fatalities rates as much as 50 percent. Read the full 2020 SafeTREC Traffic Safety Facts: Emergency Medical Services.
Alcohol-Involved Driving
While alcohol-impaired driving fatalities have fallen significantly in the last three decades, NHTSA reports that alcohol-impaired driving still comprises a large percentage of traffic injuries and fatalities. In the United States, there were 10,511 people killed in alcohol-impaired crashes in 2018, a 3.6 percent decrease from 10,908 in 2017, and a 5.7 percent increase from 9,943 in 2014. In California, there were 1,069 people killed in alcohol-impaired crashes in 2018, a 6.8 percent decrease from 1,147 in 2017, and a 22.0 percent increase from 876 in 2014. Read the full 2020 SafeTREC Traffic Safety Facts: Alcohol-Involved Driving.
Drug-Involved Driving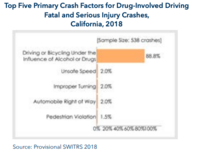
Driving can be impaired by a variety of legal and illegal drugs, substances, and medications. These various substances can impair cognition, attention, coordination, and other brain functions critical to driving safety. In the United States, 8,764 people were killed in drug-involved crashes in 2018, an 8.3 percent decrease from 9,561 in 2017, and a 21.8 percent increase from 7,193 in 2014. In California, there were 719 fatalities in drug-involved crashes in 2018, a 31.4 percent decrease from 1,048 in 2017 and a 0.8 percent decrease from 725 in 2014. Read the full 2020 SafeTREC Traffic Safety Facts: Drug-Involved Driving.
Aging Road Users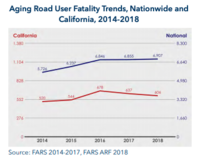
The older adult population in the United States aged 65 and older is expected to almost double between 2016 and 2060, from 49 million to 95 million. In 2018, there were 6,907 people aged 65 or older killed in a traffic crash in the United States; this accounted for 18.9 percent of all traffic fatalities. In 2018, there were 606 people aged 65 and older killed in traffic crashes in California, which is a 4.9 percent decrease from 637 in 2017. Read the full 2020 SafeTREC Traffic Safety Facts: Aging Road Users.
Speeding-Related Crashes
A speeding-related crash is defined as one where a driver is speeding, racing, driving too fast for the conditions, or driving in excess of the posted speed limit. In the United States, in 2018, over one in four (25.7 percent) fatalities involved speeding, a steady decline from a decade ago. In California, there were 927 people killed in speeding-related traffic crashes in 2018, a 20.4 percent decrease from 1,164 in 2017, and a 6.8 percent decrease from 995 in 2014. Read the full 2020 SafeTREC Traffic Safety Facts: Speeding-Related Crashes.
Funding for this program was provided by a grant from the California Office of Traffic Safety, through the National Highway Traffic Safety Administration.