2023 SafeTREC Traffic Safety Facts: Alcohol-Impaired and Alcohol-Involved Driving

Introduction 

Alcohol-impaired driving, for which data was obtained from the Fatality Analysis Reporting System (FARS), refers to fatal crashes in which at least one driver or motorcyclist was estimated to have a blood alcohol concentration (BAC) of .08 or greater.  Alcohol-involved crashes, for which the data is obtained from the Statewide Integrated Traffic Records System (SWITRS), include fatal and serious injury crashes where law enforcement reported a driver or motorcyclist to have been drinking, without specific details of BAC. For more information on how the fatalities in the Fatality Analysis Reporting System (FARS) are calculated please see the section entitled Estimated FARS Fatalities at the bottom of the webpage. 

Eliminating unsafe driving following consumption of alcohol through enforcement is part of the Safe Road Users element of the United States Department of Transportation’s Safe System Approach

While alcohol-impaired driving fatalities have fallen significantly in the last three decades, National Highway Traffic Safety Administration reports that alcohol-impaired driving still comprises a large percentage of traffic injuries and fatalities.  

National Alcohol-Impaired Driving Fatality Rate in 2021

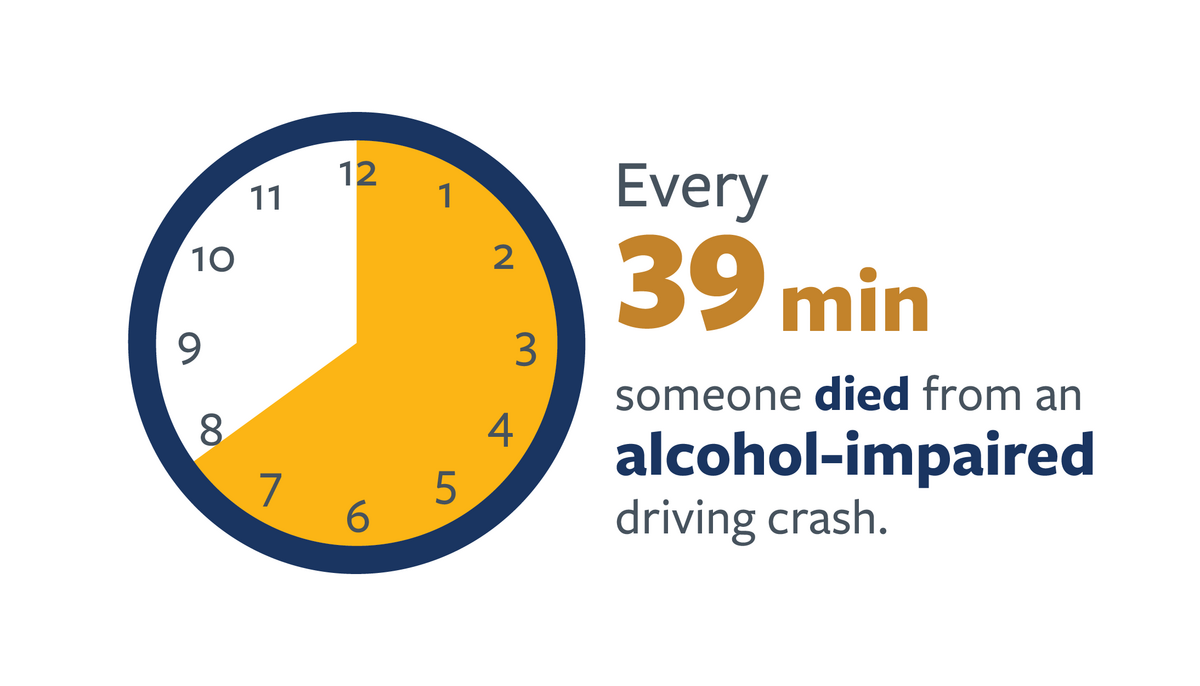
 Infographic detailing average alcohol-impaired driving crashes frequency nationally in 2021. For more information, go to the following summary.

Data Source: Stewart, T. (2023). Overview of motor vehicle traffic crashes in 2021. DOT HS 813 435. NHTSA. Table 5, page 15

Summary 

  • In 2021, someone died from an alcohol-impaired driving crash every 39 minutes.

National Trend of Alcohol-Impaired Driving Fatality Rate per 100 Million Vehicle Miles Traveled from 2020 to 2021

 Bar Chart with trend line detailing alcohol-impaired driving fatality rate per 100 million vehicle miles traveled nationally from 2020 to 2021. For more information, go to the following summary.

Data Source: Stewart, T. (2023). Overview of motor vehicle traffic crashes in 2021. DOT HS 813 435. NHTSA. Table 5, page 15

Summary

  • The alcohol-impaired driving fatality rate per 100 million vehicle miles traveled increased 7.5 percent from 0.40 in 2020 to 0.43 nationally in 2021.

Alcohol-Impaired Fatality Trends Nationwide and in California from 2017 to 2021

Trend-line chart detailing alcohol-impaired fatalities nationally and in California from 2017 to 2021.  For more information, go to the following summary.

Data source: Fatality Analysis Reporting System (FARS) 2017 – 2020 Final File & 2021 ARF

Summary 

  • Nationally, 13384 people were killed in alcohol-impaired crashes in 2021.

  • In California, there were 1370 people killed in alcohol-impaired traffic crashes in 2021.

  •  Alcohol-impaired fatalities increased nationally by 14.2  percent between 2020 and 2021.

  • Alcohol-impaired fatalities increased in California 16.1 percent between 2020 and 2021.

Nationwide Summary

Breakdown of Alcohol-Impaired Fatalities Nationwide and in California in 2021

Break-down of fatalities involving blood alcohol concentration levels nationwide and in California in 2021.  For more information, go to the following summary.

Data Source: i) Stewart, T. (2023). Overview of motor vehicle traffic crashes in 2021. DOT HS 813 435. NHTSA. Table 5, page 15; ii) State Traffic Safety Information (STSI). Traffic Safety Performance (Core Outcome)Measures for California. Washington, DC: National Highway Traffic Safety Administration, C5 

Summary

  • In 2021, 31 percent (or 13384) of all motor vehicle fatalities nationwide involved a driver who had a blood alcohol concentration of .08 or higher. 

  • In 2021, 32 percent (or 1370)  of all motor vehicle fatalities in California involved a driver who had a blood alcohol concentration of .08 or higher.

Both nationally and in California, blood alcohol concentration testing remains low in fatal crashes. 

Blood Alcohol Concentration (BAC) Driver Testing and Driver Survival Rates Nationwide in 2021

Break-down of nationwide driver blood alcohol concentration testing and survival rates in 2021.  For more information, go to the following summary.

Data Source: State Traffic Safety Information (STSI). Blood Alcohol Concentration (BAC) Reporting Rates For Drivers/Motorcycle Rider (Operators) Involved in Fatal Crashes: California , U.S. and Best State . Washington, DC: National Highway Traffic Safety Administration

Summary

  • Nationwide, only 38 percent of all drivers involved in a fatal crash had known blood alcohol concentration (BAC) test results in 2021. 

  • Nationwide, 59 percent of all drivers who died in a fatal crash and 21 percent of all drivers who survived a fatal crash had a known blood alcohol concentration (BAC) result in 2021.

Blood Alcohol Concentration (BAC) Driver Testing and Driver Survival Rates in California in 2021

Break-down of driver blood alcohol concentration testing and survival rates in California in 2021.  For more information, go to the following summary.

Data Source: State Traffic Safety Information (STSI). Blood Alcohol Concentration (BAC) Reporting Rates For Drivers/Motorcycle Rider (Operators) Involved in Fatal Crashes: California , U.S. and Best State . Washington, DC: National Highway Traffic Safety Administration

Summary 

  • In California, only 27 percent of all drivers involved in a fatal crash had known blood alcohol concentration (BAC) results in 2021. 

  • In California, 39 percent of all drivers who died in a fatal crash and 18.5 percent of all drivers who survived a fatal crash had a known blood alcohol concentration (BAC) result in 2021.

California Summary 

The information in this section refers to all victims including drivers, passengers, bicyclists, and pedestrians fatally injured in an alcohol-impaired crash and fatally or seriously injured in an alcohol-involved crash in California in 2021.

Alcohol-Impaired Fatalities and Alcohol-involved Serious Injuries by County in 2021 

Top 5 Counties in California by Fatalities

RankingCountiesFatalities
1Los Angeles258
2San Bernardino126
3San Diego94
4Riverside91
5Sacramento73

Top 5 Counties in California by Fatalities Per 100k Population

RankingCountyFatalities Per 100k Population
1Trinity53.9
2Amador19.8
3Siskiyou18.1
4Lassen17.2
5Mono15.2

Top 5 Counties in California by Serious Injuries

RankingCountySerious Injuries
1Los Angeles656
2San Diego275
3San Bernardino273
4Riverside272
5Sacramento189

Top 5 Counties in California by Serious Injuries Per 100k Population

RankingCountySerious Injuries Per 100k Population
1Amador61.7
2Plumas50.9
3Colusa50.4
4Trinity49.6
5Siskiyou47.6

Note: The number of fatalities has been rounded.

Data sources: i) Fatality Analysis Reporting System (FARS) ARF 2021; ii) Provisional Statewide Integrated Traffic Records System (SWITRS) 2021 iii) 2020 Census State Redistricting Data (P.L. 94-171) Summary File, U.S. Census Bureau

Primary Crash Factors and Crash Types for Alcohol-Involved Fatal and Serious Injury (FSI) Crashes

Alcohol-involved crashes are defined as crashes where law enforcement reported a driver or motorcyclist to have been drinking. The majority of alcohol-involved crashes will have driving or biking under the influence as a primary crash factor but some may have a different primary crash factor listed.

Top Five Primary Crash Factors of Alcohol-Involved Fatal and Serious Injury Crashes in California (2021)

Bar chart detailing the top five most common primary crash factors in alcohol-involved fatal and serious injury crashes in California in 2021. For more information, go to the following summary.

Note: Pedestrian violations occur when a pedestrian commits a violation, whereas a pedestrian right-of-way is defined as when a pedestrian’s right-of-way is violated. However, neither indicates which party is at fault for the crash. For more information on the different Crash Types, please see the Transportation Injury Mapping System (TIMS) Help FAQ page, in the Codebook - Crash Level Section

Data source: Provisional Statewide Integrated Traffic Records System (SWITRS) 2021

Summary 

  • Driving or bicycling under the influence of alcohol or drugs was the most common primary crash factor in alcohol-involved Fatal and Serious Injury (FSI) crashes in 2021 making up 75.5 percent, followed by improper turning  and unsafe speed both accounting for 6.5 percent. 
  • Pedestrian violation followed by automobile right of way made up the fourth and fifth most common primary crash factor in alcohol-involved FSI crashes in 2021 both accounting for 2.1 percent each.

Crash Location for Fatal Alcohol-Impaired Crashes

Crash Location of Alcohol-Impaired Fatal Crashes in California in 2021

 Infographic detailing the breakdown of alcohol-impaired fatal crashes by location in California in 2021. For more information, go to the following summary.

Note: Urban and Rural areas are defined in the Fatality Analysis Reporting System (FARS) based on the boundaries decided by the US Census Bureau which considers population and housing density. 

Data source: i) Fatality Analysis Reporting System (FARS) ARF 2021; ii) California Public Road Data 2020. pp. 15-17, Table 4 2020 HPMS.

https://dot.ca.gov/-/media/dot-media/programs/research-innovation-system-information/documents/california-public-road-data/prd-2020-a11y.pdf

Summary

  • Urban crashes accounted for a little less than three quarters (70 percent) of all alcohol-impaired fatal crashes in 2021 compared to the 30 percent that occurred on rural roads. 

  • For comparison, 18.5 percent of travel in 2020 occurred on rural roads. 

  • Principal arterials were the most common location for alcohol-impaired fatal crashes in 2021 accounting for 28 percent. 

  • Minor arterials, followed by interstates made up the second and third most common crash locations in alcohol-impaired fatal crashes in 2021 accounting for 19 and 17 percent respectively.  

  • Major Collectors, Other Freeways and Expressways, Local streets, and Minor Collectors constitute the remaining 36 percent.

Victim Demographics for Alcohol-Impaired Fatal and Alcohol-Involved Serious Injury Crashes

Gender, Age and Race in victims in Alcohol-impaired Fatal and Alcohol-involved Serious Injury Crashes in California in 2021

Infographic detailing the gender, age and race of victims in fatal alcohol-impaired and serious injury alcohol-involved crashes in California in 2021.

Data sources: i) Fatality Analysis Reporting System (FARS) ARF 2021; ii) Provisional Statewide Integrated Traffic Records System (SWITRS) 2021

Summary

  • Male victims made up 73 percent of all fatally injured victims in alcohol-impaired crashes in 2021, while also making up 67 percent of all seriously injured victims in alcohol-involved crashes.
  • Male victims aged 15-34 were the most represented group, making up 19.8 percent of fatalities in alcohol-impaired crashes in 2021 and 22.2 percent of serious injuries in alcohol-involved crashes. 
  • Race was reported in only 32.5 percent of all alcohol-impaired fatalities in 2021.
  • Of the 438 fatalities of alcohol-impaired crashes with a known race in 2021, 79 percent were white.

Top Five Crash Types of Alcohol-Involved Fatal and Serious Injury Crashes in California (2021)

Bar chart detailing the top five most common crash types in alcohol-involved fatal and serious injury crashes in California in 2021. For more information, go to the following summary.

Note: For more information on the different Crash Types, please see the Transportation Injury Mapping System (TIMS) Help FAQ page, in the Codebook - Crash Level Section

Data source: Provisional Statewide Integrated Traffic Records System (SWITRS) 2021

Summary

  • Rear end crashes were the most common type of alcohol-involved FSI crashes in 2021 making up 16.6 percent, followed by broadside (13.8 percent) and head-on (11.8 percent.)

  • Sideswipe crashes followed by not stated crashes made up the fourth and fifth most common type of alcohol-involved FSI crashes in 2021 accounting for 6.8 and 0.3 percent respectively.  

Time and Day of Alcohol-Impaired  Fatal and Alcohol-Involved Serious Injury Crashes

Time and Day of Alcohol-Impaired Fatal Crashes in California in 2021

 Infographic detailing the most common day and time of day in fatal alcohol-impaired crashes in California in 2021. For more information,  go to the following summary.

Data source: Fatality Analysis Reporting System (FARS) ARF 2021

Summary

  • The peak period of all alcohol-impaired fatal crashes in 2021 was between Saturday at midnight and 3am on Sunday.
  • 51.7 percent of all alcohol-impaired fatal crashes in 2021 occurred between 9pm and 3am.
  • 44.8 percent of alcohol-impaired fatal crashes in 2021 occurred Saturday and Sunday.

Time and Day of Alcohol-Involved Serious Injury Crashes in California in 2021

Infographic detailing the most common day and time of day in serious injury alcohol-involved crashes in California in 2021. For more information,  go to the following summary.

Data source: Provisional Statewide Integrated Traffic Records System (SWITRS) 2021

Summary

  • The peak period of all alcohol-involved serious injury crashes in 2021 was between Saturday midnight and 3am on Sunday.
  • 47.1 percent of all alcohol-involved serious injury crashes in 2021 occurred between 9pm and 3am. 
  • 46.4 percent of alcohol-involved fatal crashes in 2021 occurred on Saturday and Sunday.